fig7

Effect of a polyphenol-rich dietary pattern on subjects aged ≥ 60 years with higher levels of inflammatory markers: insights into microbiome and metabolome

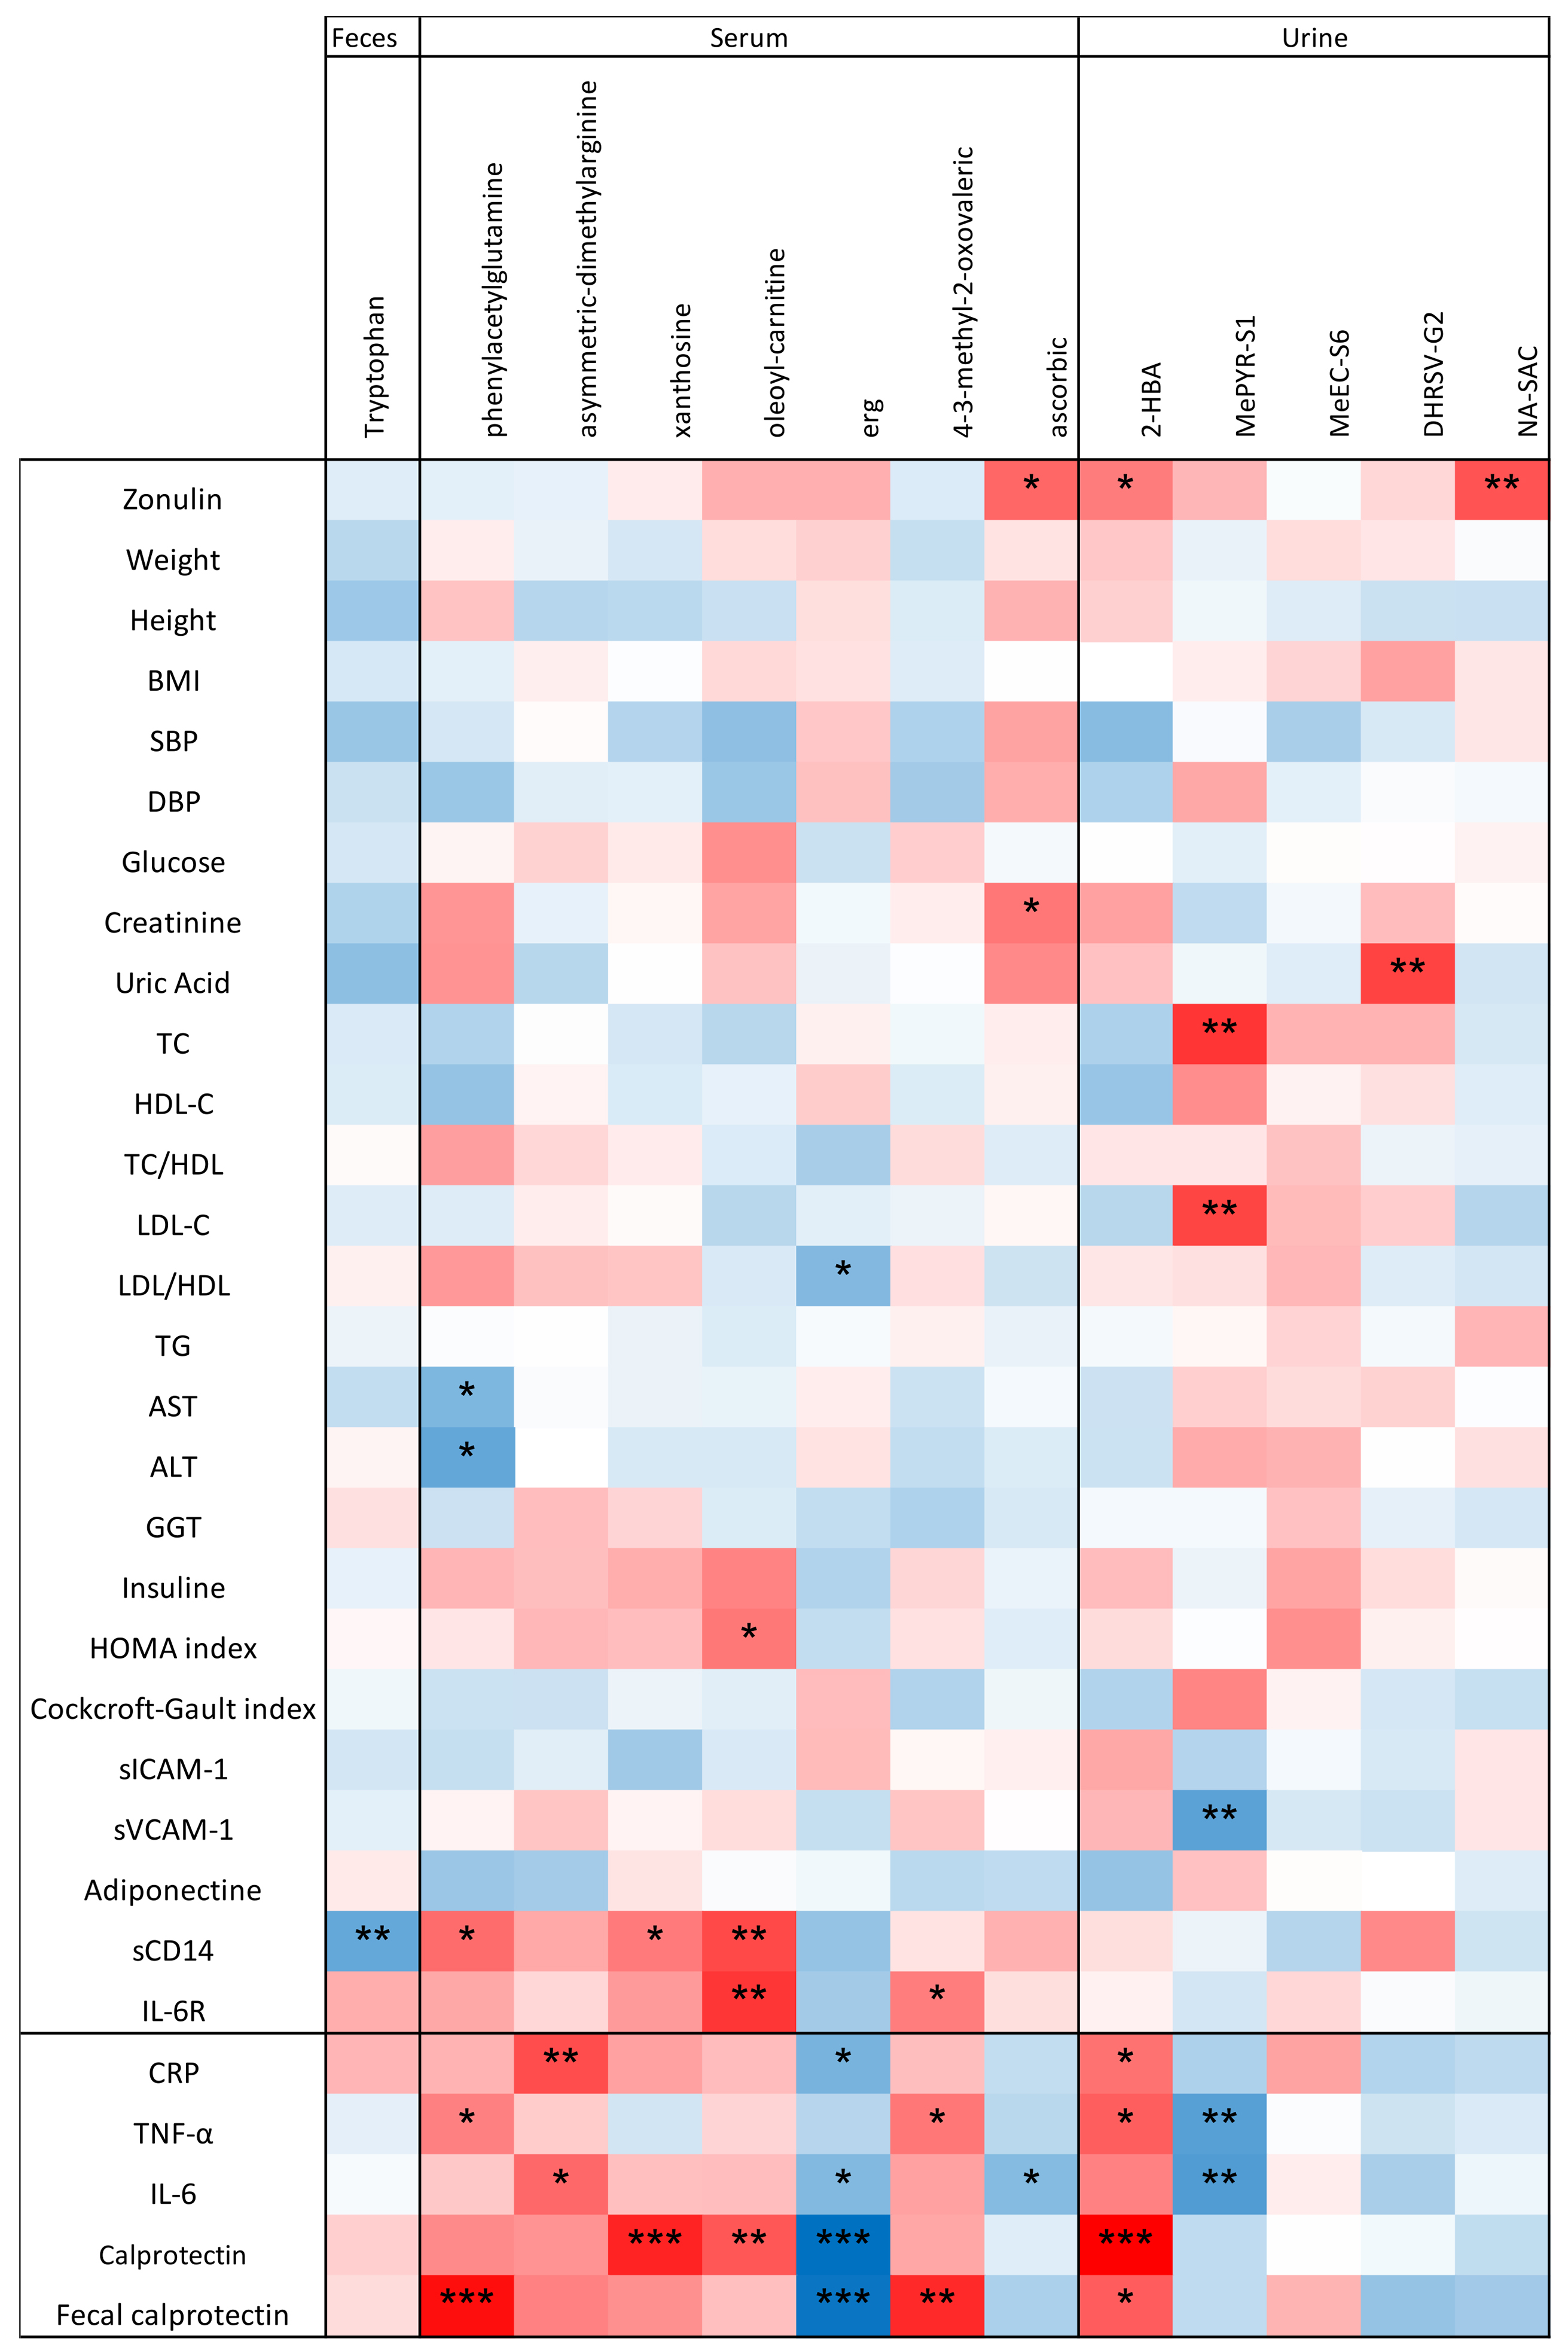
Figure 7. Correlation between physiological parameters/inflammatory markers and metabolites that significantly changed after intervention. The Kendall test was used to assess correlations. The ꞇ index defines the color scale (blue for negative correlation, red for positive correlation). Asterisks indicate significance levels: *0.1 < P < 0.05; **0.001 < P < 0.01; ***P < 0.001.

Microbiome Research Reports
ISSN 2771-5965 (Online)

Portico

All published articles are preserved here permanently:

https://www.portico.org/publishers/oae/

Portico

All published articles are preserved here permanently:

https://www.portico.org/publishers/oae/