




fig2
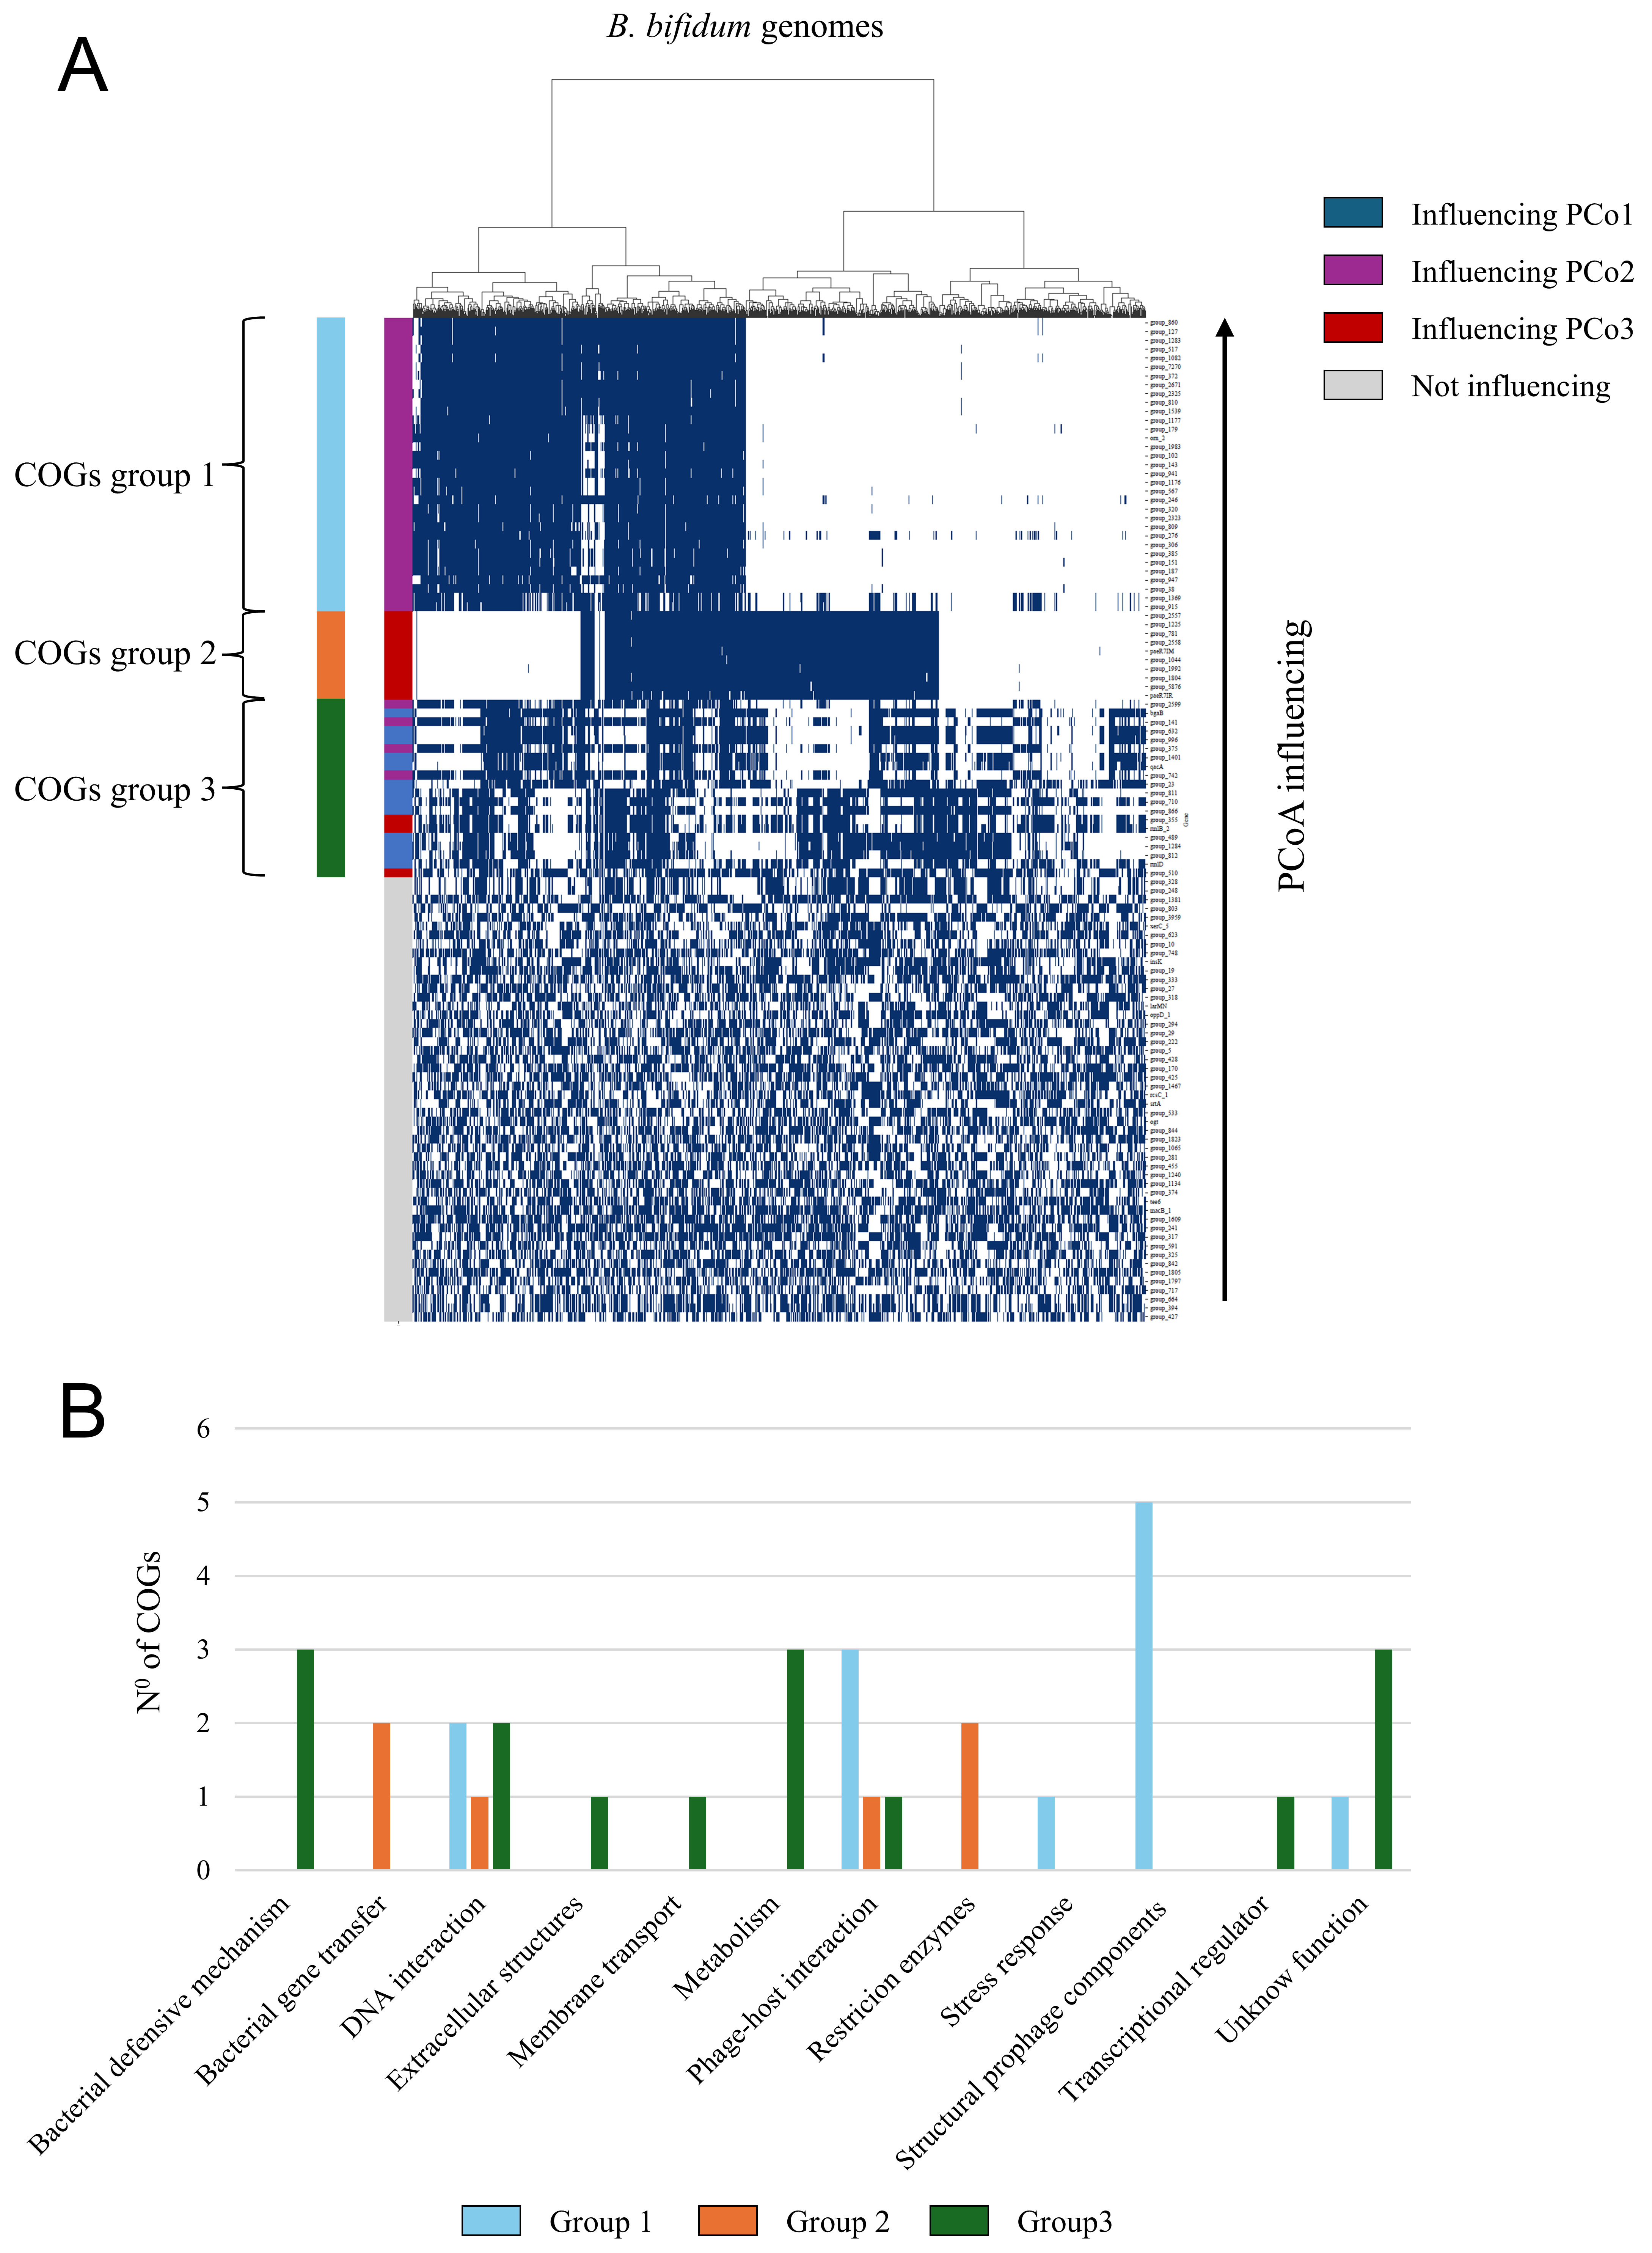
Figure 2. Analysis of the 113 bipartite GoF/LoF COGs in the B. bifidum dataset. (A) shows a heatmap of COG presence/absence in the genomes, with the three COG groups highlighted to the left. The upper dendrogram shows the dataset’s genomes redistributed into four subclusters based on the presence of the COGs considered; (B) shows the distribution of the COGs of the three identified groups into different functional groups, based on the PROKKA and Roary annotations and the protein domains identified by InterProScan. COG: Clusters of orthologous gene; PCo: principal coordinate; GoF/LoF: gain and loss of function.